
Squiggs
TS Team
In case it's of any interest to anyone, here's a tracker of attraction count vs attendance over the years at Alton Towers.
The 'Weighted Running Total' line is probably a better reflection of the value of the attractions being added, as during the John Broome era they were adding lots of 'bits and bobs', whereas Tussauds (and to a degree Merlin) went with less attractions, but focused on greater quality.
Broadly speaking, what you can see from the data here is that during the 'golden eras' of the Theme Park years the two blue lines track very close to one another, ideally with the light blue 'Weighted Running Total' line tracking slightly higher than the dark blue 'Attendance' line - this represents the park adding a good mix of headline and 'filler' attractions, responding to demand from the consumer.
And you can clearly see the tumultuous few years that have just passed, certainly in the park's attraction portfolio. TEA haven't released the 2024 figures yet, but I wouldn't be surprised if we don't see attendance line continue to rise in 2024, despite the dip in attraction count, which would track with the general perception that there are not currently enough rides (and other infrastructure) in the park to cope with the consumer demand.
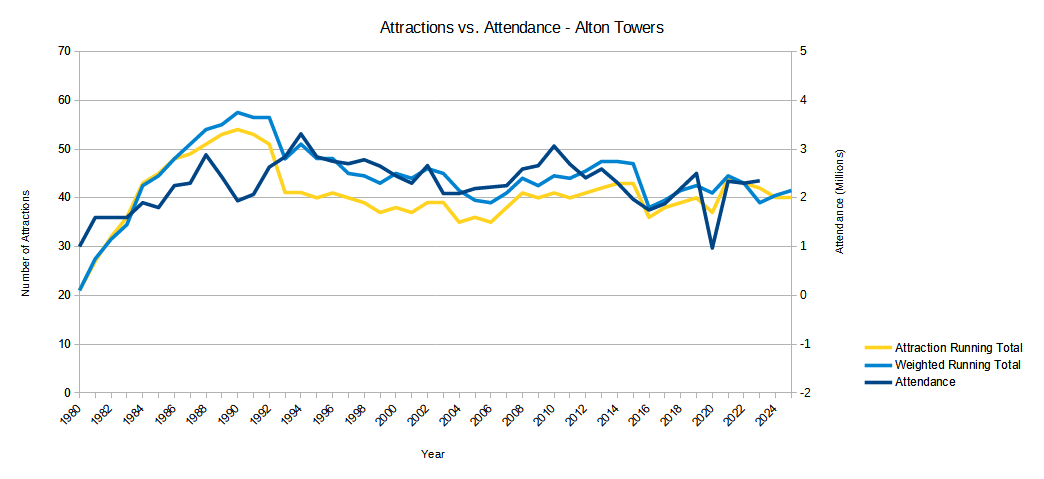
For reference, attraction count here includes major shows (i.e. not walkabout or incidental/event entertainment) and no heritage assets.
The yellow line is tracking the Running Total with all attractions weighted as equals (e.g. a coaster is worth the same as a kiddie carousel). Whereas the 'Weighted running total' takes into account the prominence of attractions, so a headline attraction is worth more than a more minor or temporary additions, etc.
The scale on the attendance line is based on whichever source seems most 'official' in the Alton Towers visitor figures through the years thread. And note that the scale on this line is offset, mainly to allow for easier comparison with the other datasets.
The 'Weighted Running Total' line is probably a better reflection of the value of the attractions being added, as during the John Broome era they were adding lots of 'bits and bobs', whereas Tussauds (and to a degree Merlin) went with less attractions, but focused on greater quality.
Broadly speaking, what you can see from the data here is that during the 'golden eras' of the Theme Park years the two blue lines track very close to one another, ideally with the light blue 'Weighted Running Total' line tracking slightly higher than the dark blue 'Attendance' line - this represents the park adding a good mix of headline and 'filler' attractions, responding to demand from the consumer.
And you can clearly see the tumultuous few years that have just passed, certainly in the park's attraction portfolio. TEA haven't released the 2024 figures yet, but I wouldn't be surprised if we don't see attendance line continue to rise in 2024, despite the dip in attraction count, which would track with the general perception that there are not currently enough rides (and other infrastructure) in the park to cope with the consumer demand.
For reference, attraction count here includes major shows (i.e. not walkabout or incidental/event entertainment) and no heritage assets.
The yellow line is tracking the Running Total with all attractions weighted as equals (e.g. a coaster is worth the same as a kiddie carousel). Whereas the 'Weighted running total' takes into account the prominence of attractions, so a headline attraction is worth more than a more minor or temporary additions, etc.
The scale on the attendance line is based on whichever source seems most 'official' in the Alton Towers visitor figures through the years thread. And note that the scale on this line is offset, mainly to allow for easier comparison with the other datasets.
Last edited: