Benjsh
TS Member
- Favourite Ride
- Stardust Racers
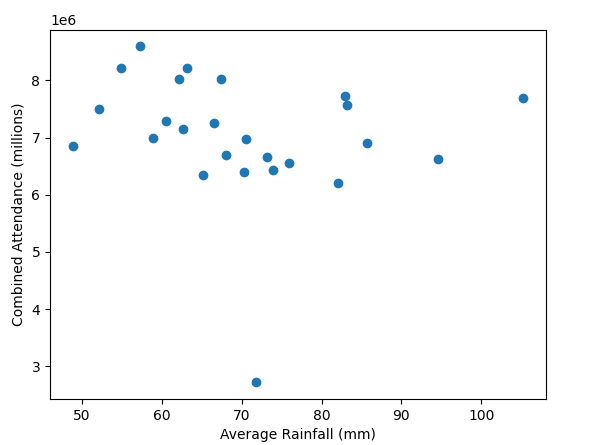
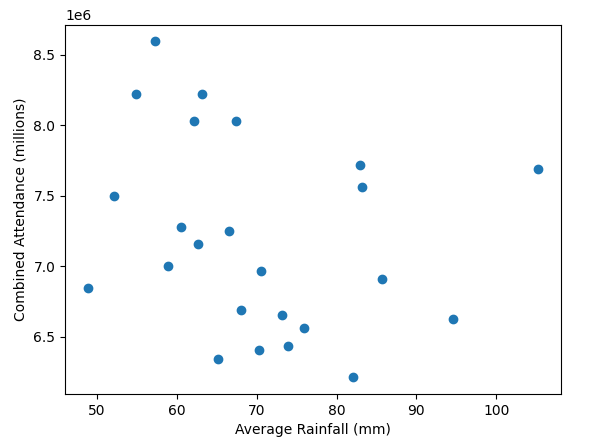
All these old gate figures don't show one big thing; weather. A prolonged washout in the summer months would do more to damage a seasons gate than a new ride opening would likely do to improve it. In the days before prebook and onsite hotels if the weather looked ropey people wouldn't bother, it was only really coach trips that were committed to visiting in advance.
A very good point also. People in the south don't always remember how much rain we get up north.