- News all the latest
- Theme Park explore the park
- Resort tour the resort
- Future looking forward
- History looking back
- Community and meetups
-
ℹ️ Heads up...
This is a popular topic that is fast moving Guest - before posting, please ensure that you check out the first post in the topic for a quick reminder of guidelines, and importantly a summary of the known facts and information so far. Thanks. - Thread starter AT86
- Start date
- Favourite Ride
- Wicker Man
- Favourite Ride
- VelociCoaster (Islands of Adventure)
- Favourite Ride
- Wicker Man
- Favourite Ride
- VelociCoaster (Islands of Adventure)
- 1984: 1,843,750 (first year, #1/3 on graph)
- 1985: 1,812,500 (-1.7%, #1/3 on graph)
- 1986: 2,250,000 (+24.1%, #1/3 on graph)
- 1987: 2,312,500 (+2.8%, #1/4 on graph)
- 1988: 2,875,000 (+24.3%, #1/4 on graph)
- 1989: 2,437,500 (-15.2%, #1/4 on graph)
- 1990: 1,937,500 (-20.5%, #1/4 on graph)
- 1991: 1,843,750 (-3.6%, #1/4 on graph)
- 1992: 2,625,000 (+42.4%, #1/4 on graph)
- 1993: 2,843,750 (+8.3%, #1/4 on graph)
- 1994: 3,312,500 (+16.5%, #1/3 on graph)
- 1995: 2,843,750 (-14.2%, #1/3 on graph)
- 1996: 2,875,000 (+1.1%, #1/3 on graph)
- 1997: 2,875,000 (0.0%, #1/4 on graph)
- 1998: 2,875,000 (0.0%, #1/4 on graph)
- 1999: 2,593,750 (-9.8%, #1/4 on graph)
- 2000: 2,437,500 (-6.0%, #1/4 on graph)
- 2001: 2,187,500 (-10.3%, #1/4 on graph)
- 2002: 2,656,250 (+21.4%, #1/4 on graph)
- 2003: 2,562,500 (-4.7%, #1/4 on graph)
- 2004: 2,086,750 (-18.6%, #1/4 on graph)
- 2005: 2,187,500 (+4.8%, #1/4 on graph)
- 2006: 2,218,750 (+1.4%, #1/4 on graph)
- 2007: 2,250,000 (+1.4%, #1/4 on graph)
- 2008: 2,593,750 (+15.3%, #1/4 on graph)
- 2009: 2,656,250 (+2.4%, #1/4 on graph)
- 2010: 3,062,500 (+14.0%, #1/4 on graph)
- 2011: 2,687,500 (-12.2%, #1/4 on graph)
- 2012: 2,406,250 (-10.5%, #1/4 on graph)
- 2013: 2,593,750 (+7.8%, #1/4 on graph)
- 2014: 2,312,500 (-10.8%, joint #2/4 on graph)
- 2015: 1,968,750 (-14.9%, #2/4 on graph)
- 2016: 1,750,000 (-9.7%, #2/4 on graph)
- 2017: 1,875,000 (+7.1%, #2/4 on graph)
- 2018: 2,187,500 (+16.7%, #1/4 on graph)
- 2019: 2,500,000 (+14.3%, #1/4 on graph)
- 2020: 968,750 (-61.3%, #1/4 on graph)
- 2021: 2,343,750 (+141.9%, #1/4 on graph)
- 1984: 625,000 (first year, #3/3 on graph)
- 1985: 562,500 (-10.0%, #3/3 on graph)
- 1986: 500,000 (-11.1%, #3/3 on graph)
- 1987: 875,000 (+75.0%, #3/4 on graph)
- 1988: 1,187,500 (+35.7%, joint #3/4 on graph)
- 1989: 1,250,000 (+5.3%, #3/4 on graph)
- 1990: 1,062,500 (-15.0%, joint #3/4 on graph)
- 1991: 1,437,500 (+35.3%, #2/4 on graph)
- 1992: 1,218,750 (-15.2%, #2/4 on graph)
- 1993: 1,531,250 (+25.6%, #2/4 on graph)
- 1994: 1,687,500 (+10.2%, #2/3 on graph)
- 1995: 1,875,000 (+11.1%, #2/3 on graph)
- 1996: 1,812,500 (-3.3%, #2/3 on graph)
- 1997: 1,843,750 (+1.7%, #2/4 on graph)
- 1998: 1,843,750 (0.0%, #2/4 on graph)
- 1999: 1,656,250 (-10.2%, #2/4 on graph)
- 2000: 1,562,500 (-5.7%, #3/4 on graph)
- 2001: 1,531,250 (-2.0%, joint #3/4 on graph)
- 2002: 1,281,250 (-16.3%, #4/4 on graph)
- 2003: 1,312,500 (+2.4%, #4/4 on graph)
- 2004: 1,218,750 (-7.1%, #4/4 on graph)
- 2005: 1,093,750 (-10.3%, #4/4 on graph)
- 2006: 1,031,250 (-5.7%, #4/4 on graph)
- 2007: 968,750 (-6.1%, #4/4 on graph)
- 2008: 1,250,000 (+29.0%, #4/4 on graph)
- 2009: 1,343,750 (+7.5%, #4/4 on graph)
- 2010: 1,437,500 (+7.0%, #4/4 on graph)
- 2011: 1,500,000 (+4.3%, #4/4 on graph)
- 2012: 1,406,250 (-6.2%, #4/4 on graph)
- 2013: 1,531,250 (+8.9%, #4/4 on graph)
- 2014: 1,562,500 (+2.0%, #4/4 on graph)
- 2015: 1,437,500 (-8.0%, #4/4 on graph)
- 2016: 1,437,500 (0.0%, #4/4 on graph)
- 2017: 1,500,000 (+4.3%, #4/4 on graph)
- 2018: 1,593,750 (+6.3%, joint #4/4 on graph)
- 2019: 1,656,250 (+3.9%, #3/4 on graph)
- 2020: 500,000 (-69.8%, #4/4 on graph)
- 2021: 1,281,250 (+156.3%, #3/4 on graph)
- 2022: 1,468,750 (+14.6%, N/A)
- 1987: 812,500 (first year, #4/4 on graph)
- 1988: 875,000 (+7.7%, #4/4 on graph)
- 1989: 968,750 (+10.7%, #4/4 on graph)
- 1990: 1,062,500 (+9.7%, joint #3/4 on graph)
- 1991: 1,031,250 (-2.9%, #3/4 on graph)
- 1992: 968,750 (-6.1%, #4/4 on graph)
- 1993: 937,500 (-3.2%, #4/4 on graph)
- 1994: N/A (-100.0%, N/A on graph)
- 1995: N/A (0.0%, N/A on graph)
- 1996: N/A (0.0%, N/A on graph)
- 1997: 1,468,750 (first year as LLW, #3/4 on graph)
- 1998: 1,312,500 (-10.6%, #3/4 on graph)
- 1999: 1,500,000 (+14.3%, #3/4 on graph)
- 2000: 1,687,500 (+12.5%, #2/4 on graph)
- 2001: 1,531,250 (-9.3%, joint #3/4 on graph)
- 2002: 1,593,750 (+4.1%, #2/4 on graph)
- 2003: 1,437,500 (-9.8%, #3/4 on graph)
- 2004: 1,437,500 (0.0%, #3/4 on graph)
- 2005: 1,500,000 (+4.3%, #3/4 on graph)
- 2006: 1,625,000 (+8.3%, #3/4 on graph)
- 2007: 1,500,000 (-7.8%, #3/4 on graph)
- 2008: 1,875,000 (+25.0%, #2/4 on graph)
- 2009: 1,906,250 (+1.7%, #3/4 on graph)
- 2010: 1,906,250 (0.0%, #3/4 on graph)
- 2011: 1,906,250 (0.0%, #3/4 on graph)
- 2012: 2,031,250 (+6.6%, #2/4 on graph)
- 2013: 2,312,500 (+13.8%, #2/4 on graph)
- 2014: 2,312,500 (0.0%, joint #2/4 on graph)
- 2015: 2,343,750 (+1.4%, #1/4 on graph)
- 2016: 2,187,500 (-6.6%, #1/4 on graph)
- 2017: 2,312,500 (+5.7%, #1/4 on graph)
- 2018: 2,125,000 (-8.1%, #2/4 on graph)
- 2019: 2,062,500 (-2.9%, #2/4 on graph)
- 2020: 687,500 (-66.7%, #2/4 on graph)
- 2021: 1,562,500 (+122.7%, #2/4 on graph)
- 1983: 843,750 (first year, #1/1 on graph)
- 1984: 1,031,250 (+22.2%, #2/3 on graph)
- 1985: 1,093,750 (+6.1%, #2/3 on graph)
- 1986: 1,093,750 (0.0%, #2/3 on graph)
- 1987: 1,093,750 (0.0%, #2/4 on graph)
- 1988: 1,187,500 (+8.6%, joint #3/4 on graph)
- 1989: 1,343,750 (+13.2%, #2/4 on graph)
- 1990: 1,000,000 (-25.6%, #4/4 on graph)
- 1991: 968,750 (-3.1%, #4/4 on graph)
- 1992: 1,093,750 (+12.9%, #3/4 on graph)
- 1993: 1,281,250 (+17.1%, #3/4 on graph)
- 1994: 1,218,750 (-4.9%, #3/3 on graph)
- 1995: 1,125,000 (-7.7%, #3/3 on graph)
- 1996: 1,187,500 (+5.6%, #3/3 on graph)
- 1997: 968,750 (-18.4%, #4/4 on graph)
- 1998: 875,000 (-9.7%, #4/4 on graph)
- 1999: 906,250 (+3.6%, #4/4 on graph)
- 2000: 937,500 (+3.4%, #4/4 on graph)
- 2001: 1,187,500 (+26.7%, #4/4 on graph)
- 2002: 1,437,500 (+21.1%, #3/4 on graph)
- 2003: 1,531,250 (+6.5%, #2/4 on graph)
- 2004: 1,468,750 (-4.1%, #2/4 on graph)
- 2005: 1,562,500 (+6.4%, #2/4 on graph)
- 2006: 1,812,500 (+16.0%, #2/4 on graph)
- 2007: 1,843,750 (+1.7%, #2/4 on graph)
- 2008: 1,843,750 (0.0%, #3/4 on graph)
- 2009: 2,125,000 (+15.3%, #2/4 on graph)
- 2010: 2,187,500 (+2.9%, #2/4 on graph)
- 2011: 2,125,000 (-2.9%, #2/4 on graph)
- 2012: 1,843,750 (-13.2%, #3/4 on graph)
- 2013: 1,786,250 (-3.1%, #3/4 on graph)
- 2014: 1,843,750 (+3.2%, #3/4 on graph)
- 2015: 1,531,250 (-17.0%, #3/4 on graph)
- 2016: 1,625,000 (+6.1%, #3/4 on graph)
- 2017: 1,562,500 (-3.9%, #3/4 on graph)
- 2018: 1,593,750 (+2.0%, joint #4/4 on graph)
- 2019: 1,500,000 (-5.9%, #4/4 on graph)
- 2020: 562,500 (-62.5%, #3/4 on graph)
- 2021: 1,218,750 (+116.7%, #4/4 on graph)
- Alton Towers may have been top dog for the bulk of the years since 1984, but it has also had the most volatile guest figures. It has had peaks as high as 3.3 million in 1994, but also troughs of only slightly above 2 million in the mid-2000s or even slightly below in the early 1990s and mid-2010s, with a nadir of 1.75 million being reached in 2016. At that point, it was well away from #1 and almost rubbing shoulder to shoulder with #3 park Thorpe. Interestingly, its peak was early, in 1994, and only 2010 has ever come close to that since. Merlin have attained fair growth at Alton Towers; between 2007 and 2019, attendance grew by 11.1%.
- Chessington World of Adventures started off fairly well, attaining steady growth from 1987 up until 1994, where it stayed at its peak until about 1997. However, attendance dropped through the floor from 1998 onwards, hitting a low of under 1 million in 2007, so it's fair to say that Chessington's trajectory has been far from uniform, although things improved notably under Merlin. Interestingly, Chessington is the park that has thrived most under Merlin, with attendance having grown by 74.1% between 2007 and 2019. Nonetheless, the high water mark was hit quite early on at Chessington, with that near 2 million peak guest figure being all the way back in 1995, and no year post-1997 has yet come close to it.
- Legoland Windsor has had the most consistent growth trajectory of all the parks. With its low back near opening in 1998, its peak in 2015 and no particularly catastrophic attendance drops (COVID aside), it's grown fairly consistently over the years. It's also a park that has thrived pretty well under Merlin; between 2005 and 2019, attendance grew by 37.5%.
- Thorpe Park has had a bit of a roller coaster of a growth trajectory. The 80s and 90s were a little bit choppy at Thorpe Park, with peaks of close to 1.5 million and lows of under 1 million. The park really hit its stride from 2001 onwards, maintaining a near perfect growth trajectory right up to the park's 2.2 million peak in 2010. However, things have been a bit of a struggle since then, with guest figures having almost consistently declined since 2011 right back to a low of 1.5 million in 2019. The park has comparatively struggled under Merlin, with attendance having fallen by 18.6% between 2007 and 2019.
- Favourite Ride
- Air / Blue Fire
- Favourite Ride
- Spinball Whizzer

- Favourite Ride
- VelociCoaster (Islands of Adventure)
- Favourite Ride
- Stardust Racers

You are using an out of date browser. It may not display this or other websites correctly.
You should upgrade or use an alternative browser.
You should upgrade or use an alternative browser.
UK Merlin park guest figures through the years
pluk
TS Member
The other potential thing to bear in mind is what kind of day out did those guests in 1998 have? If people were waiting 3hrs to get on Oblivion they may well have not had the best experience and decided not to come back. Hence the drop in the subsequent years.
I was thinking the same. Years when something big opens that year generally has possitive figures with the marketing impact, probably more telling us the subsequent year. If year 2 dips below year -1 that is likely an indication people weren't impressed.
Oblivion had the ride time vs queue time issue, and let's face it whatever followed Nemesis might seem a bit underwhelming, numbers fall.
Thirteen is mismarketed and doesn't hit the thrill its marketed on, numbers fall.
Storm Surge at Thorpe is awful in every way, the same pattern.
WickerwomanH
TS Member
Ah I hadn't considered this probably because I don't quite remember the Thirteen marketing in comparison to the Smiler marketing which was still quite intense, with spray painting sheep and projecting the logo onto parliament, etcFrom what I can tell, Thirteen had a more extensive marketing campaign and a lot more hype leading up to it than Smiler did, which may have helped.
ChristmasPud
TS Member
That was just PR stunt though, neither actually happened. The projection was a photoshop job apparently and the sheep probably just a favour off a farmer next door. Although yeah I remember Thirteen and Smiler about the same level and same tactics.with spray painting sheep and projecting the logo onto parliament, etc
I dont know if Thirteen's promo actually made much difference outside enthusiasts, or if they just timed stuff right that year. They were riding off the back of a lot renewed interest in the park with Merlin's initial rebrand/investment. Thorpe Park also had a peak around that time so maybe people were just really into theme parks post recession
Last edited:
Matt N
TS Member
I think an interesting thing to point out is that Derren Brown’s Ghost Train actually spawned a fair increase in attendance at Thorpe in the year it opened.
So it would appear that DBGT might have been more of a success than it’s often given credit for… maybe Thorpe’s future is in dark rides and immersive attractions as opposed to roller coasters?
I also find it interesting how Chessington has had a pretty substantial rise in guest figures since Merlin took over, in spite of not too much seemingly happening. Towards the end of the Tussauds era, the park was hovering at around 1 million guests or slightly below, but since Merlin’s takeover, the park seems to have had quite a substantial attendance boost (easily 50%). I wonder why Merlin’s presence gave Chessington such a big rise?
Furthermore, I’m very intrigued to see that Thorpe is (or was in 2019) now the least visited Merlin park in the country, and its attendance is now back down to where it was in the early 2000s, when Colossus and Nemesis Inferno first opened. I wonder why that could be?
Is there any way that these numbers can be whittled down to finer figures (e.g. hundreds of thousands)?
Last edited:
jon81uk
TS Member
I think they pushed annual passes far more than Tussauds did. Also by adding in Sea Life and Legoland the annual pass looked a fantastic deal to anyone living in that area as you had three theme parks and all the London attractions close by.I wonder why Merlin’s presence gave Chessington such a big rise?
WickerwomanH
TS Member
After looking into it turns out I was wrong about the parliament thing I must have got confused, but the sheep definitely happened. I was just making the point that from my memory there was lots of promotion of the smiler, which I remember more so than the promo for thirteen simply because I was older and had more of an interest in AT by that point.That was just PR stunt though, neither actually happened. The projection was a photoshop job apparently and the sheep probably just a favour off a farmer next door. Although yeah I remember Thirteen and Smiler about the same level and same tactics.
I dont know if Thirteen's promo actually made much difference outside enthusiasts, or if they just timed stuff right that year. They were riding off the back of a lot renewed interest in the park with Merlin's initial rebrand/investment. Thorpe Park also had a peak around that time so maybe people were just really into theme parks post recession
Tom
TS Member
Something I’ve only just noticed; I’m not sure if I’m reading the graph right, but did Chessington’s guest figures actually decrease the year Vampire/Transylvania opened?
Seemingly so, but you would have to say it appears to have played a major part in almost doubling attendances the following 5 years.
Matt N
TS Member
Note: I intend to keep editing this post with new figures as time goes on and the graph gets updated.
Sorry to bump this thread, but I had some time on my hands this evening and decided to try and extrapolate some slightly more precise guest figures for each park from this graph to try and determine the precise(ish) attendance trajectory of each UK Merlin park from the earliest year listed here (1984 for Alton Towers and Chessington, 1983 for Thorpe Park, 1987 for Windsor Safari Park and 1997 for Legoland Windsor).
For some idea, this is the original graph I was working with: https://www.cwoa-consultation.com/proposals?lightbox=dataItem-komw1163
To make things easier for myself, I divided each million on the graph into 8 rows (thus leaving ~125,000 guests per row, as my rather crude MS Paint annotation indicates):
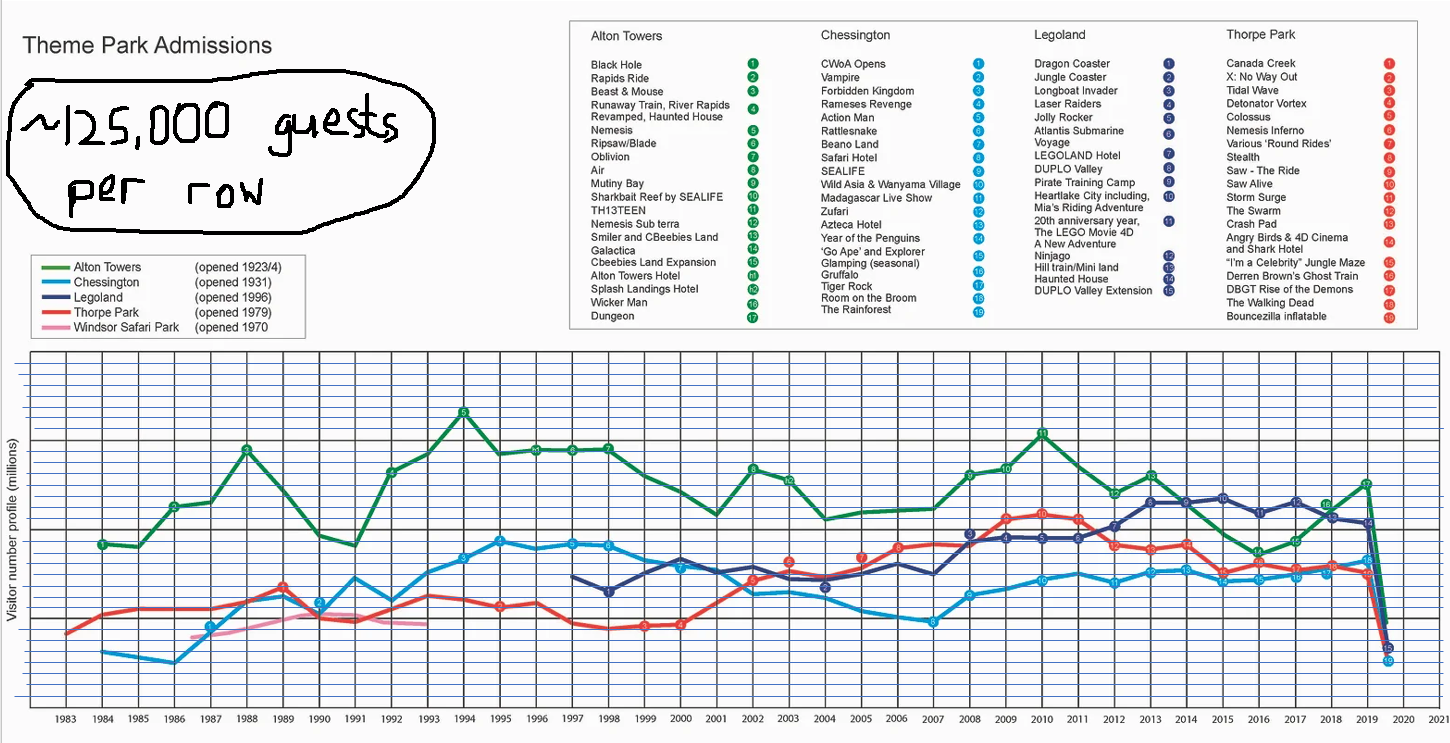
As such, I then decided to extrapolate a precise(ish) figure from the graph by looking at what row each park's figure fell within. All of these figures are rounded to the nearest 31,250; I know that sounds oddly specific, but it's 1/32 of a million, and a quarter of one of these rows, so it's the most precise figure that remains easy to determine by eye. It also keeps the margin of error to only 1 or 2 percent in most cases.
The precise(ish) trajectories that I managed to extrapolate for each park, including percentage increases and decreases for each year, were as follows:
Alton Towers - opened 1980, first year on graph 1984
All-Time Low (excluding 2020): 1,750,000 (2016)
Peak Within Merlin Era (2008 and later): 3,062,500 (2010)
Low Within Merlin Era (2008 and later, excluding 2020 and 2021): 1,750,000 (2016)
Chessington World of Adventures/Chessington Zoo - opened 1931, first year on graph 1984, first year as CWOA 1987
All-Time Low (excluding 2020 and 2021, including pre-CWOA years): 500,000 (1986)
All-Time Low (excluding 2020 and 2021 and pre-CWOA years): 875,000 (1987)
Peak Within Merlin Era (2008 and later): 1,687,500 (2019)
Low Within Merlin Era (2008 and later, excluding 2020 and 2021): 1,281,250 (2008)
Legoland Windsor/Windsor Safari Park - opened 1970, first year on graph 1987, first year as Legoland Windsor 1996
All-Time Low (excluding 2020 and 2021, including pre-LLW years): 812,500 (1987)
All-Time Low (excluding 2020, 2021 and pre-LLW years): 1,312,500 (1998)
Peak Within Merlin Era (2006 and later): 2,343,750 (2015)
Low Within Merlin Era (2006 and later, excluding 2020 and 2021): 1,500,000 (2007)
Thorpe Park - opened 1979, first year on graph 1983
All-Time Low (excluding 2020 and 2021): 843,750 (1983)
Peak Within Merlin Era (2008 and later): 2,187,500 (2010)
Low Within Merlin Era (2008 and later, excluding 2020 and 2021): 1,500,000 (2019)
To sum up each park's trajectory:
Sorry to bump this thread, but I had some time on my hands this evening and decided to try and extrapolate some slightly more precise guest figures for each park from this graph to try and determine the precise(ish) attendance trajectory of each UK Merlin park from the earliest year listed here (1984 for Alton Towers and Chessington, 1983 for Thorpe Park, 1987 for Windsor Safari Park and 1997 for Legoland Windsor).
For some idea, this is the original graph I was working with: https://www.cwoa-consultation.com/proposals?lightbox=dataItem-komw1163
To make things easier for myself, I divided each million on the graph into 8 rows (thus leaving ~125,000 guests per row, as my rather crude MS Paint annotation indicates):
As such, I then decided to extrapolate a precise(ish) figure from the graph by looking at what row each park's figure fell within. All of these figures are rounded to the nearest 31,250; I know that sounds oddly specific, but it's 1/32 of a million, and a quarter of one of these rows, so it's the most precise figure that remains easy to determine by eye. It also keeps the margin of error to only 1 or 2 percent in most cases.
The precise(ish) trajectories that I managed to extrapolate for each park, including percentage increases and decreases for each year, were as follows:
Alton Towers - opened 1980, first year on graph 1984
All-Time Low (excluding 2020): 1,750,000 (2016)
Peak Within Merlin Era (2008 and later): 3,062,500 (2010)
Low Within Merlin Era (2008 and later, excluding 2020 and 2021): 1,750,000 (2016)
Chessington World of Adventures/Chessington Zoo - opened 1931, first year on graph 1984, first year as CWOA 1987
All-Time Low (excluding 2020 and 2021, including pre-CWOA years): 500,000 (1986)
All-Time Low (excluding 2020 and 2021 and pre-CWOA years): 875,000 (1987)
Peak Within Merlin Era (2008 and later): 1,687,500 (2019)
Low Within Merlin Era (2008 and later, excluding 2020 and 2021): 1,281,250 (2008)
Legoland Windsor/Windsor Safari Park - opened 1970, first year on graph 1987, first year as Legoland Windsor 1996
All-Time Low (excluding 2020 and 2021, including pre-LLW years): 812,500 (1987)
All-Time Low (excluding 2020, 2021 and pre-LLW years): 1,312,500 (1998)
Peak Within Merlin Era (2006 and later): 2,343,750 (2015)
Low Within Merlin Era (2006 and later, excluding 2020 and 2021): 1,500,000 (2007)
Thorpe Park - opened 1979, first year on graph 1983
All-Time Low (excluding 2020 and 2021): 843,750 (1983)
Peak Within Merlin Era (2008 and later): 2,187,500 (2010)
Low Within Merlin Era (2008 and later, excluding 2020 and 2021): 1,500,000 (2019)
To sum up each park's trajectory:
Last edited:
Tim
TS Member
I'm curious as to what caused the major attendance drop at Alton Towers in 2014. The Smiler and Cbeebies had just opened and the crash wasn't until 2015.
I wasn't aware 2014 was a particularly bad year but the graph shows this as the point Altons attendance dropped below LEGOLAND.
They could have fudged the numbers slightly by only using 2013 and 2015 as the data points.
I wasn't aware 2014 was a particularly bad year but the graph shows this as the point Altons attendance dropped below LEGOLAND.
They could have fudged the numbers slightly by only using 2013 and 2015 as the data points.
Nick🎢
TS Member
One note of caution I would make is something we see in shares quite when focused in like this.
It's quite common to watch a share you own and convincingly relate all the movements to things the company is doing and how the market expectantly or unexpectedly reacts to it. Often you then look at other unrelated companies and see their movements correlated quite accurately.
What I am saying is, numbers and changes often are not directly related to changes at the parks but are reflective of the bigger picture in the world. Things as simple as a generally poor summer can throw demand right down for things.
BarryZola
TS Member
It could be stuff like not having as many good promo's for reduced price entry etc. The numbers soon picked up in the late 2010s when they started doing the whole 'convert your day ticket to a season pass for free'. As most will be well aware, higher attendances don't necessarily mean more revenue from ticket sales. As soon as covid got into full swing and people couldn't go abroad which meant Towers had a captive audience they stopped the mega-cheapo passes as they knew they'd get visitors anyway.I'm curious as to what caused the major attendance drop at Alton Towers in 2014. The Smiler and Cbeebies had just opened and the crash wasn't until 2015.
I wasn't aware 2014 was a particularly bad year but the graph shows this as the point Altons attendance dropped below LEGOLAND.
They could have fudged the numbers slightly by only using 2013 and 2015 as the data points.
Squiggs
TS Team
It could potentially be linked to CBeebies Land not opening till the end of May. It meant for the first two months of the season there were basically no rides suitable for the youngest children, which would no doubt have somewhat hit visitor numbers during that period if families decided to hold off visiting.I'm curious as to what caused the major attendance drop at Alton Towers in 2014. The Smiler and Cbeebies had just opened and the crash wasn't until 2015.
I wasn't aware 2014 was a particularly bad year but the graph shows this as the point Altons attendance dropped below LEGOLAND.
They could have fudged the numbers slightly by only using 2013 and 2015 as the data points.
Matt N
TS Member
Another thing I found very interesting was that Alton Towers’ peaks, when they occurred, were often very fleeting compared to those of the other parks.
The park’s two big peaks, in 1994 and 2010 respectively, literally only lasted for those years.
In 1993, park attendance was 2.84 million. In 1994, the launch of Nemesis made park attendance go up by nearly 500,000; guest figures hit 3.31 million in 1994. In 1995, however… attendance fell back to exactly the same 2.84 million figure as 1993. Therefore, none of the 500,000 new guests who went in 1994 returned in 1995, and any growth gained off the back of Nemesis was extremely short-term; the park was quite literally back to square one in 1995.
Ditto with 2010. In 2009, park attendance was 2.69 million. In 2010, the launch of Thirteen made park attendance go up by close to 400,000, hitting 3.06 million and breaching the 3 million mark for the first time since 1994 and only the second time in park history. In 2011, though… attendance fell back to exactly the same 2.69 million figure as 2009, meaning that none of the new guests who went for Thirteen in 2010 returned in 2011, and the attendance growth gained from it was short lived. As with Nemesis in 1994, the park literally went straight back to square one the year after opening.
You also see this with the big peak of the Broome era; in 1988, park attendance grew all the way to 2.88 million from a mere 2.31 million in 1987, and 1988 is still one of the park’s highest years to this day. The additions of The Beast and The Alton Mouse, as well as the opening of Coaster Corner more generally, were the catalyst for staggering attendance growth. In 1989, however… attendance fell all the way back down to 2.41 million, so all bar 100,000 of the guests gained in 1988 did not return in 1989. Roughly 80% of the park’s gains in 1988 were wiped out the season after.
It’s weird, because none of the other parks’ peaks were so fleeting; all of the others maintained a fairly “peak” attendance level for at least a couple of years. Thorpe Park’s peak attendance of 2.1-2.2 million, stimulated by the addition of Saw The Ride in 2009, held strong right through until 2011, and attendance actually grew slightly in 2010 even after the initial huge growth of 2009. Chessington’s peak attendance of 1.8-1.9 million, stimulated by the addition of Rameses Revenge in 1995, held fairly strong above the 1.8 million mark right through until 1998. Legoland’s peak attendance of 2.3-2.4 million, initially stimulated by the extension of Duplo Valley in 2013, held fairly strong above the 2.3 million mark right through until 2015 (and attendance actually grew slightly in that time), and the 2.3 million mark was hit again very soon after in 2017.
I wonder why Alton Towers’ peaks are so brief compared to those of every other UK Merlin park? Thorpe Park, Chessington World of Adventures and Legoland Windsor were all able to hold (or even consistently grow past in some cases) the peak attendances stimulated by new investments for at least a good couple of years afterwards, whereas most of Alton Towers’ big peaks literally seemed to last for the opening year of the big investment and dissipate completely the year after like they never happened… it’s truly baffling.
jon81uk
TS Member
I guess because AT has the better reputation anyway, the park is well known so the base level of visitors is higher. Whereas Thorpe probably gets more people only realising they park exists when they add something new.wonder why Alton Towers’ peaks are so brief compared to those of every other UK Merlin park? Thorpe Park, Chessington World of Adventures and Legoland Windsor were all able to hold (or even consistently grow past in some cases) the peak attendances stimulated by new investments for at least a good couple of years afterwards, whereas most of Alton Towers’ big peaks literally seemed to last for the opening year of the big investment and dissipate completely the year after like they never happened… it’s truly baffling.
Benjsh
TS Member
Gate figures are NOT an exact science. Plenty of visitors in those 'peak' years may have decided to go elsewhere the following year for a change. Doesn't necessarily mean they had a bad time at Towers.
I dont visit the same park over and over again myself. I can go quite a while between visits to even Towers. I haven't even been once this season for example. We will be going for our one and only trip during Scarefest this year for a change.
I dont visit the same park over and over again myself. I can go quite a while between visits to even Towers. I haven't even been once this season for example. We will be going for our one and only trip during Scarefest this year for a change.